Ad Hoc Vs Continuous Research in Principles of Business
What is ad hoc analysis?
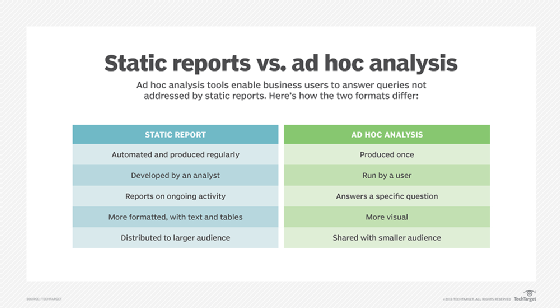
Ad hoc analysis is a business intelligence (BI) process designed to answer a specific business question by using company data from various sources. A report helps stakeholders assess an event and formulate actionable next steps.
With ad hoc analysis, users can extract the insight they need to make better business decisions without having to involve the IT department. Typically, an ad hoc report is more visual than a standard data report, making it easy for a non-technical audience to understand and utilize.
What are the benefits of ad hoc analysis?
Ad hoc analysis is performed by business users on an as-needed basis to address data analysis needs not met by the business's static, regular reporting. The benefits of self-service BI conducted by ad hoc analysis tools include the following:
1. Customizability
Ad hoc analysis tools provide enterprise data analytics across the organization, supporting a variety of niche business needs, and feature customizable reports to meet the specific needs of users.
Many BI solutions also provide templates for easier adoption, limiting data intake to only what is needed. For more advanced users, SQL queries enable a more granular experience, selecting specific business data for reports.
2. Ease of use
Most data exploration BI tools are user-friendly and are built with the non-technical user in mind. The interfaces and dashboards are intuitive and simplify data analysis through a single-use report.
3. Reduces the IT workload
Ad hoc reporting tools for self-service business intelligence allow users to create timely and tailored reports. This speeds up decision-making and response times to business queries.
4. Saves time and financial resources
The intuitive functionality of ad hoc analysis tools eliminates the need for developers to help with queries and create reports. This saves the business money and allows IT teams to focus on other tasks.
Ad hoc analysis use cases
Data analysis is critical to make informed decisions that help drive business growth goals. Ad hoc analysis begins with BI tools connected to company data sources. Security parameters for user access to the data are specified by IT, and report models can be built for users to utilize when creating ad hoc reports. The product is typically a statistical model, analytical report or other type of data summary, presented in charts, tables and cross-tabulations.
Online analytical processing (OLAP) dashboards are specifically designed to facilitate ad hoc analysis by providing quick, easy access to data from the original report. Common features of ad hoc reporting tools also include drop-down menus and drag-and-drop tools that enable untrained business users to drill down into the data.
Ad hoc analysis can also be applied to big data from sources held outside of the company. This may be more complex than using company data sources due to the large volume of both structured and unstructured data. But the valuable insights held within big data can help companies improve customer service, boost revenue or increase efficiencies.
There are numerous examples of how ad hoc analysis helps organizations.
Sales
Ad hoc analysis can help sales organizations home in on trends and how they impact sales. For example, ad hoc reports can show how an event influences sales at a particular point in time or over a specific timeframe. Users can dig into any aspect of the sales process that is slowing the sales cycle. Or, a company can analyze the effectiveness of its marketing strategy and determine if a new course of action is needed.
Banking and finance
Analytics is crucial for financial services because the industry generates a large amount of transactions and stores huge amounts of data. Financial services businesses including banks traditionally relied on historical data and trends to forecast future performance, but today they are tapping into ad hoc data analytics to track and model additional data sources. This helps them better measure and quantify risk, improve cash flow and boost corporate value.
Healthcare
Ad hoc analysis promotes greater transparency in the healthcare industry, enabling stakeholders to make better decisions around budgeting, staffing and resource allocation.
Healthcare facilities use ad hoc analysis to evaluate blood test results or track how many patients were admitted to the ER in a given day, week, month or year. This insight can lead to greater operational efficiency and lower mortality rates.
Government
Government agencies handle massive amounts of data and use ad hoc analysis to help with challenges and decision-making on the local, state and federal levels. It helps to better allocate funding, boost productivity and improve resource utilization.
Education
In the education sector, analyzing data can help streamline processes and ensure that programs are properly engaging students and improving success rates.
Evaluating ad hoc reporting tools
Ad hoc analysis tools offer organizations the ability to decentralize data management and put the power of analysis in the hands of end users. These tools provide improved intelligence over the manual creation of many versions of Excel spreadsheets.
The right tool helps users create targeted reports for on-the-spot analysis, and helps improve processes and relevant key performance indicators.
There are a number of important features in ad hoc analysis tools.
1. Reporting customization
Designed to simplify data analysis and reports, these tools allow users to select specific data sets and present that data visually with actionable insights for quicker decision-making.
2. Multiple data sources
The ability to pool data from multiple tools and systems improves analysis by providing a rich data set.
3. Basic and advanced features
While ad hoc reporting solutions are built for the average, non-technical user, it's important that analysis tools offer more advanced features for users who want deeper granular analysis.
4. Data visualization capabilities
Data visualization helps users better understand large volumes of data and derive meaning from that data. Business intelligence tools allow users to customize reports with preferred charts, graphs, columns, etc.
Additionally, options like filters, sliders and conditional formatting improve reports, ensuring business users that they're getting information that's targeted and easy to understand.
5. Sharing options
The ability to share ad hoc analyses with other stakeholders and business units is vital. Business intelligence often needs to be shared across the organization for better decision-making and business improvement.
Sharing options include email capability, URL link sharing and dashboards that can be embedded on private webpages.
Source: https://www.techtarget.com/searchbusinessanalytics/definition/ad-hoc-analysis
Post a Comment for "Ad Hoc Vs Continuous Research in Principles of Business"